Top 5 Google Analytics KPIS You Need To Know
Two things are for sure when it comes to understanding your web presence:
1. There’s a lot to know.
2. You don’t know it.
We got you. We’ve put together the top 5 Google Analytics that will help you get a handle on your marketing KPIs (Key Performance Indicators) – whether you’re on your own or deciphering reports from your marketing company.
As your company’s marketing go-to, you’re already knee-deep in rolling out 2020 marketing objectives, putting muscle behind your web presence to hit high-level business goals. That’s a big job. Maybe you’re flying solo on this responsibility, or you’re trying to interpret reports sent from your marketing company. Or, perhaps you’re the CEO, attempting to make heads or tails out of a complex digital landscape. Everyone is telling you the web is important, that mobile is important, that traffic and analytics are important. But what should you really be paying attention to?
So, What Do All Those Google Analytics Mean?
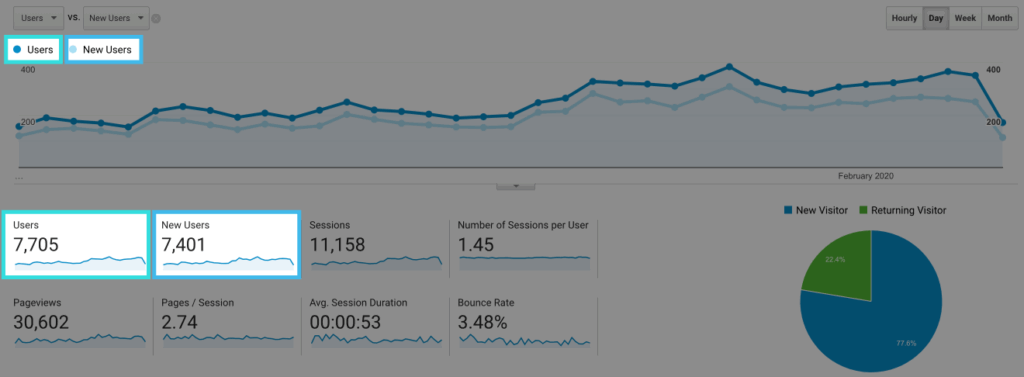
1. Users Vs. New Users
- User: The number of new and returning individuals who visit your site during a set time frame.
- New User: The number of times a user visits your site for the first time during a set time frame.
Typically, reports track Users and New Users in one-month increments. The first time a person visits your website, Google Analytics creates a cookie to count the user’s visits.
Why Is This Important?
Tracking users shows your site’s traffic or how many people are visiting your site. Without traffic, there’s no revenue.
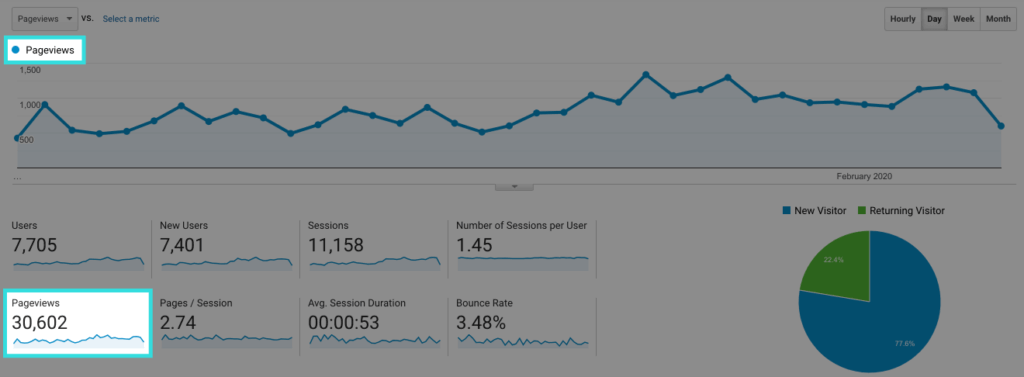
2. Pageviews
- Pageviews: The total number of pages visited during a given time frame.
The Pageviews number counts every page visit, no matter whether a user has been there before or whether they visit multiple pages on your site.
Why Is This Important?
Tracking Pageview lets you know what pages on your site are attracting the most users. If certain content is gaining more views than others, then you know what kind of content is driving traffic and driving revenue.
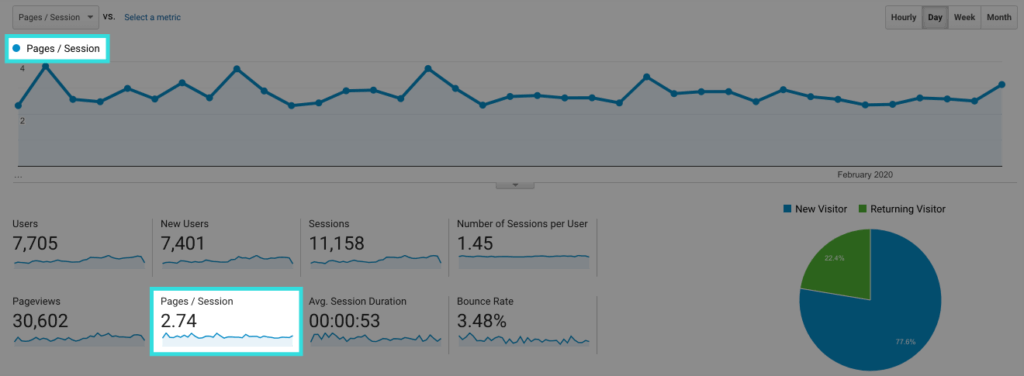
3. Pages/Sessions
- Pages/Session: The average number of pages visited by each user in a given time frame.
Why Is This Important?
Pages/Session gives you a better feel for how well a user flows through your site, from one page to another. The higher the Pages/Session number, the more likely a user will proceed along the path to converting the visit into a sale.
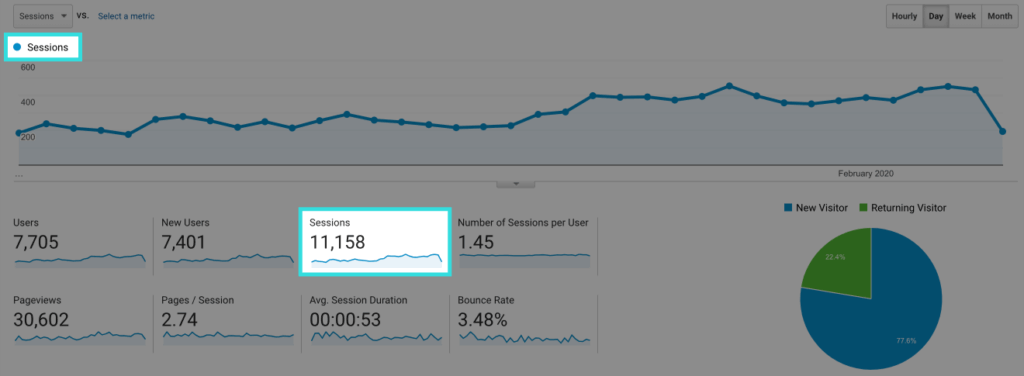
4. Sessions
- Sessions: A user’s visit to your site.
A session number measures the user’s visit to your site no matter where the user starts, where the user ends, how many pages the user views, or how much time the user spends browsing.
- Average Session Duration: The average amount of time a user spends on each session, counted in minutes and seconds, during a given time frame.
By default, users who remain inactive for 30 minutes or more on your site are measure as a new session if or when the user resumes browsing.
- Number of Sessions Per User: The number of visits each user has during a given time frame.
Why Is This Important?
The average session duration and the number of sessions per user capture user engagement. Think time = money. The longer a user stays on your site, the greater the opportunity for conversion to a sale. Also, the higher the sessions per user, the greater the conversion, as a user may not purchase upon the first visit, but in a subsequent visit.
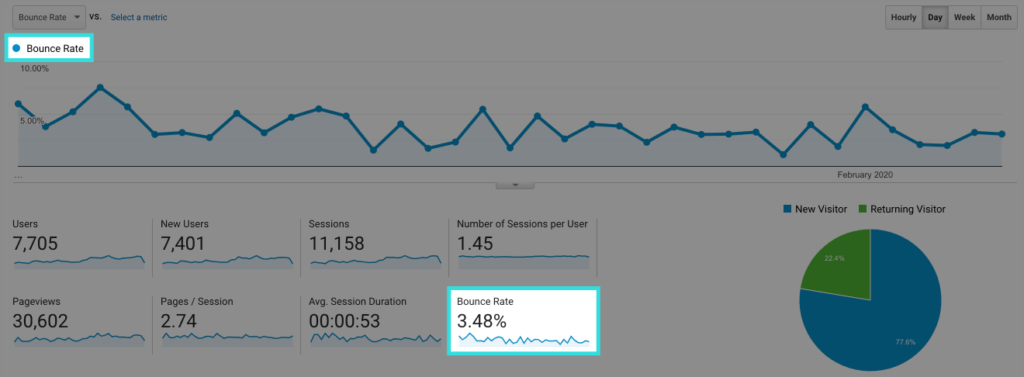
5. Bounce Rate
- Bounce Rate: The rate at which users reach and leave your website from the entrance page.
Why Is This Important?
Bounce rate measures the visit quality, or “stickiness” of your site, meaning how well users engage and “stick around” on your site. Generally, a low bounce rate means the user is visiting multiple pages on the site. A high bounce rate may indicate that your site’s entrance page (aka landing page) is not relevant to users. Keep in mind to consider the bounce rate within the context of the action you’re hoping the user will do. For example, if the goal is to get the user to complete an action on a page and leave (such as to submit a form), then a higher bounce rate would be expected.
What Do You Do With All This Google Analytics Information?
Feel a little smarter? We hope so. Still think there’s more to know? You bet. There’s a whole lot of power behind those Google Analytics to help your site climb to new heights. And, we’re holding the ladder to steady your way. Let’s help you get started.


